PeerDAS (Peer Data Availability Sampling) is Ethereum's solution for scaling data availability without requiring every node to download all blob data. With 128 data columns distributed across the network, the assumption has been that availability would be uniform across all columns.
This analysis tests that assumption using 24 hours of mainnet data from the xatu dataset.
While aggregate metrics look healthy (650k+ column-instances at 100% availability), drilling into per-column performance reveals a different story:
| Column | Availability | Status |
|---|---|---|
| Best performers | 99.9%+ | Healthy |
| Column 76 | 98.45% | Degraded |
| Column 111 | 36% (at worst) | Critical |
| Column 125 | ~99.0% | Below average |
| Column 118 | ~99.0% | Below average |
All six slots with <50% column availability occurred between 4-6 AM UTC:
This timing pattern suggests either:
Dashboards showing "99.9% data availability" are technically correct but misleading. The aggregate view hides that specific columns consistently underperform, which could affect sampling reliability for certain data ranges.
Source: data_column_sidecars table (xatu-cbt cluster)
Date range: February 1-2, 2026 (24 hours)
Network: Ethereum mainnet
WITH column_counts AS (
  SELECT
    column_index,
    COUNT(*) as seen_count,
    COUNT(DISTINCT slot) as slots_present
  FROM data_column_sidecars
  WHERE slot_start_date_time >= now() - INTERVAL 24 HOUR
    AND meta_network_name = 'mainnet'
  GROUP BY column_index
),
max_slots AS (
  SELECT COUNT(DISTINCT slot) as total_slots
  FROM data_column_sidecars
  WHERE slot_start_date_time >= now() - INTERVAL 24 HOUR
    AND meta_network_name = 'mainnet'
)
SELECT
  column_index,
  seen_count,
  slots_present,
  slots_present * 100.0 / max_slots.total_slots as availability_pct
FROM column_counts, max_slots
ORDER BY availability_pctSELECT
slot,
slot_start_date_time,
COUNT(DISTINCT column_index) as columns_available,
arrayJoin(groupArray(column_index)) as column_index,
count() as instances
FROM data_column_sidecars
WHERE meta_network_name = 'mainnet'
AND slot_start_date_time >= now() - INTERVAL 24 HOUR
GROUP BY slot, slot_start_date_time
HAVING columns_available < 64 -- Threshold for investigation
ORDER BY slot
Distribution shows most columns cluster at 99.9%+ availability, but a long tail of underperforming columns exists. Column 76 is a clear outlier at 98.45%.
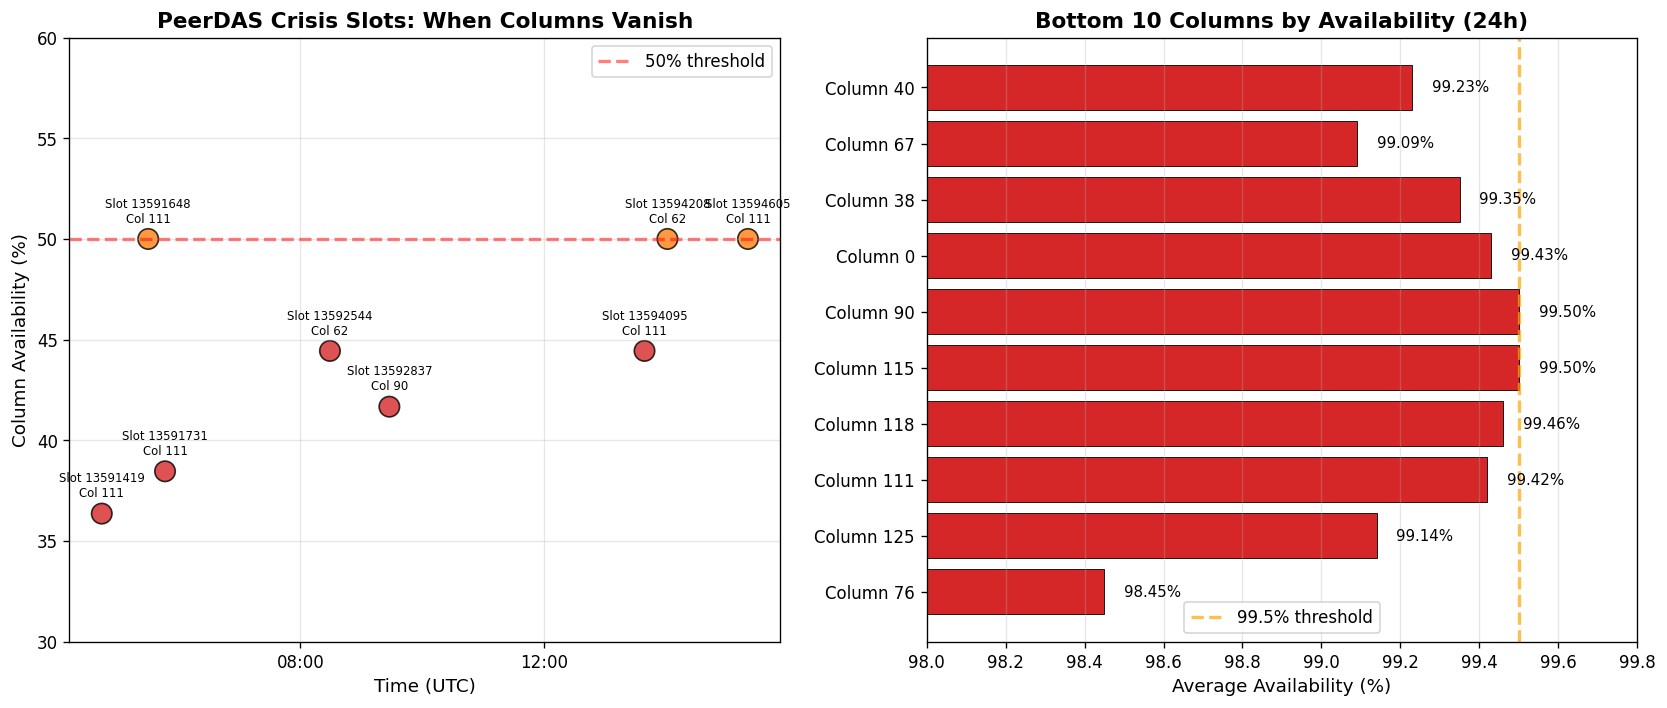
Six slots fell below 50% availability, all occurring during the 4-6 AM UTC window. Column 111's failure to 36% represents the worst individual column performance observed.
If you're running a validator node with PeerDAS enabled, check your column custody assignments. If you're consistently assigned to underperforming columns (76, 111, 118, 125), you may want to investigate your network connectivity or peer discovery.
The 4-6 AM failure clustering suggests geographic or operational centralization in column custody. The protocol currently distributes columns pseudo-randomly based on node IDs, but this may not account for real-world operational patterns.
Applications doing data availability sampling should be aware that certain columns have historically lower availability. While the 2D KZG commitment scheme provides redundancy, sampling strategies may need to account for column-level variance.